Here are the softwares developped at the CIML and through our collaboration with the Institut Fresnel
- Softwares
- UNsupervised particle LOCalization (UNLOC) developed on Matlab and ImageJ by the He&Marguet & PhyTI teams
- Methods for Automated and Accurate Analysis of Cell Signals (MAAACS) developed on Matlab by the H&M team, dedicated to calcium imaging
- Multiple Target Tracing (MTT) developed on Matlab by the H&M team, dedicated to single molecule analysis (SPT)
- A Shiny application to analyze tissue section images (Saphir)
Softwares
Unsupervised particle LOCalization (UNLOC) developed on Matlab and ImageJ by the He&Marguet & PhyTI teams
The UNLOC ImageJ plugin, including a user’s manual and the scripts for the charts is freely available here for academic and nonprofit use and referenced as Mailfert et al, Biophys J, 2018 DOI: 10.1016/j.bpj.2018.06.02.
UNLOC has been developed in close collaboration with Nicolas Bertaux (Institut Fresnel, PhyTI team).
A theoretical defining of the reliability of single-molecule localization microscopy (SMLM) observations is pre-requisite to assessing accuracy and robustness for localization precision. We have characterized the bias on the localization precision based on an appropriate estimator and the Cramér-Rao bound (CRB) without prior knowledge on the intensity to avoid a noticeable overestimation on the precision of localization for data with high local density/frame or complex background or both. Our theoretical study allowed us to develop new tools for accurate quantitative SMLM analyses:
(i) a unique density-SNR space diagram that enables standardized evaluation of the localization accuracy expected from experimental data;
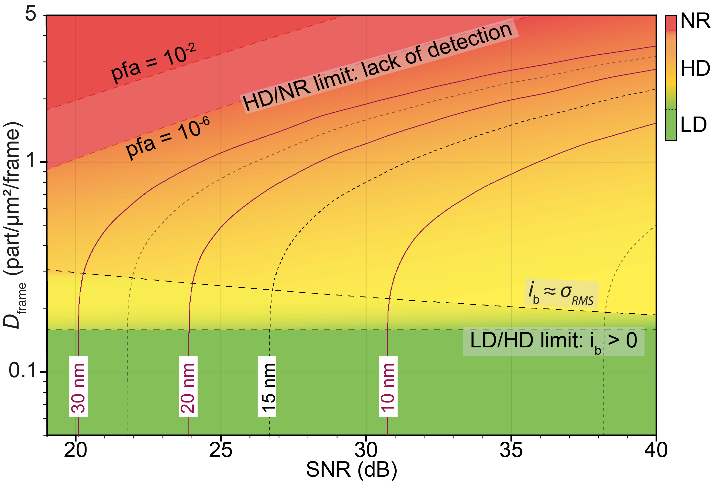
Density-SNR space diagram. The low density (LD), high density (HD) and non-resolvable (NR) regions are green, orange and red color-coded, respectively. The LD/HD limit is independent of the SNR. Then, in a green to orange transition, the bias ?b becomes of the same order of magnitude as ???? the precision of localization. Accurate data analysis then requires an HD algorithm up to a density where the particles are no longer resolvable (orange to red transition). This limit, which depends on the SNR, is set by the level of PFA stringency acceptable for a given experiment. The isocurves delineate in the case of uniformly distributed particles the precision reached by 80% of the particles (??=80%).
(ii) UNLOC, a real parameter-free, robust and fast computing algorithm available as a plugin for ImageJ and especially useful for any inexperienced researchers requiring rigorous SMLM quantification.
- Although UNLOC accounts for spatiotemporal variations in the background, signal-to-noise (SNR) and local particle density, it only requires the PSF size of the microscope to build a list of particle localizations.
- UNLOC is divided into three modules: (i) a detection/estimation module performed in an iterative process together with optimization of the number, position and intensity of the particles, and also the PSF size if requested; (ii) a reconnection module to minimize an overrepresentation of particles in the reconstructed image using statistical tracking of the particle history over the frames; (iii) an optional module for drift correction and classical image rendering methods.
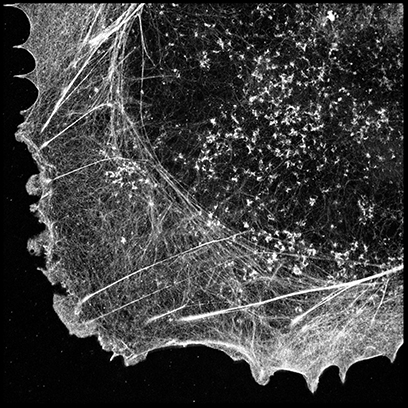
dSTORM super-resolved image of Alexa FluorTM 647-phalloidin labeled actin filaments in fixed COS-7 cells analyzed by UNLOC. The sample preparation is described in Xu et al., Nat Meth 2012.
Methods for Automated and Accurate Analysis of Cell Signals (MAAACS)
This software was developed in close collaboration with Nicolas Bertaux (Institut Fresnel, PhyTi team) and is freely downloadable here.
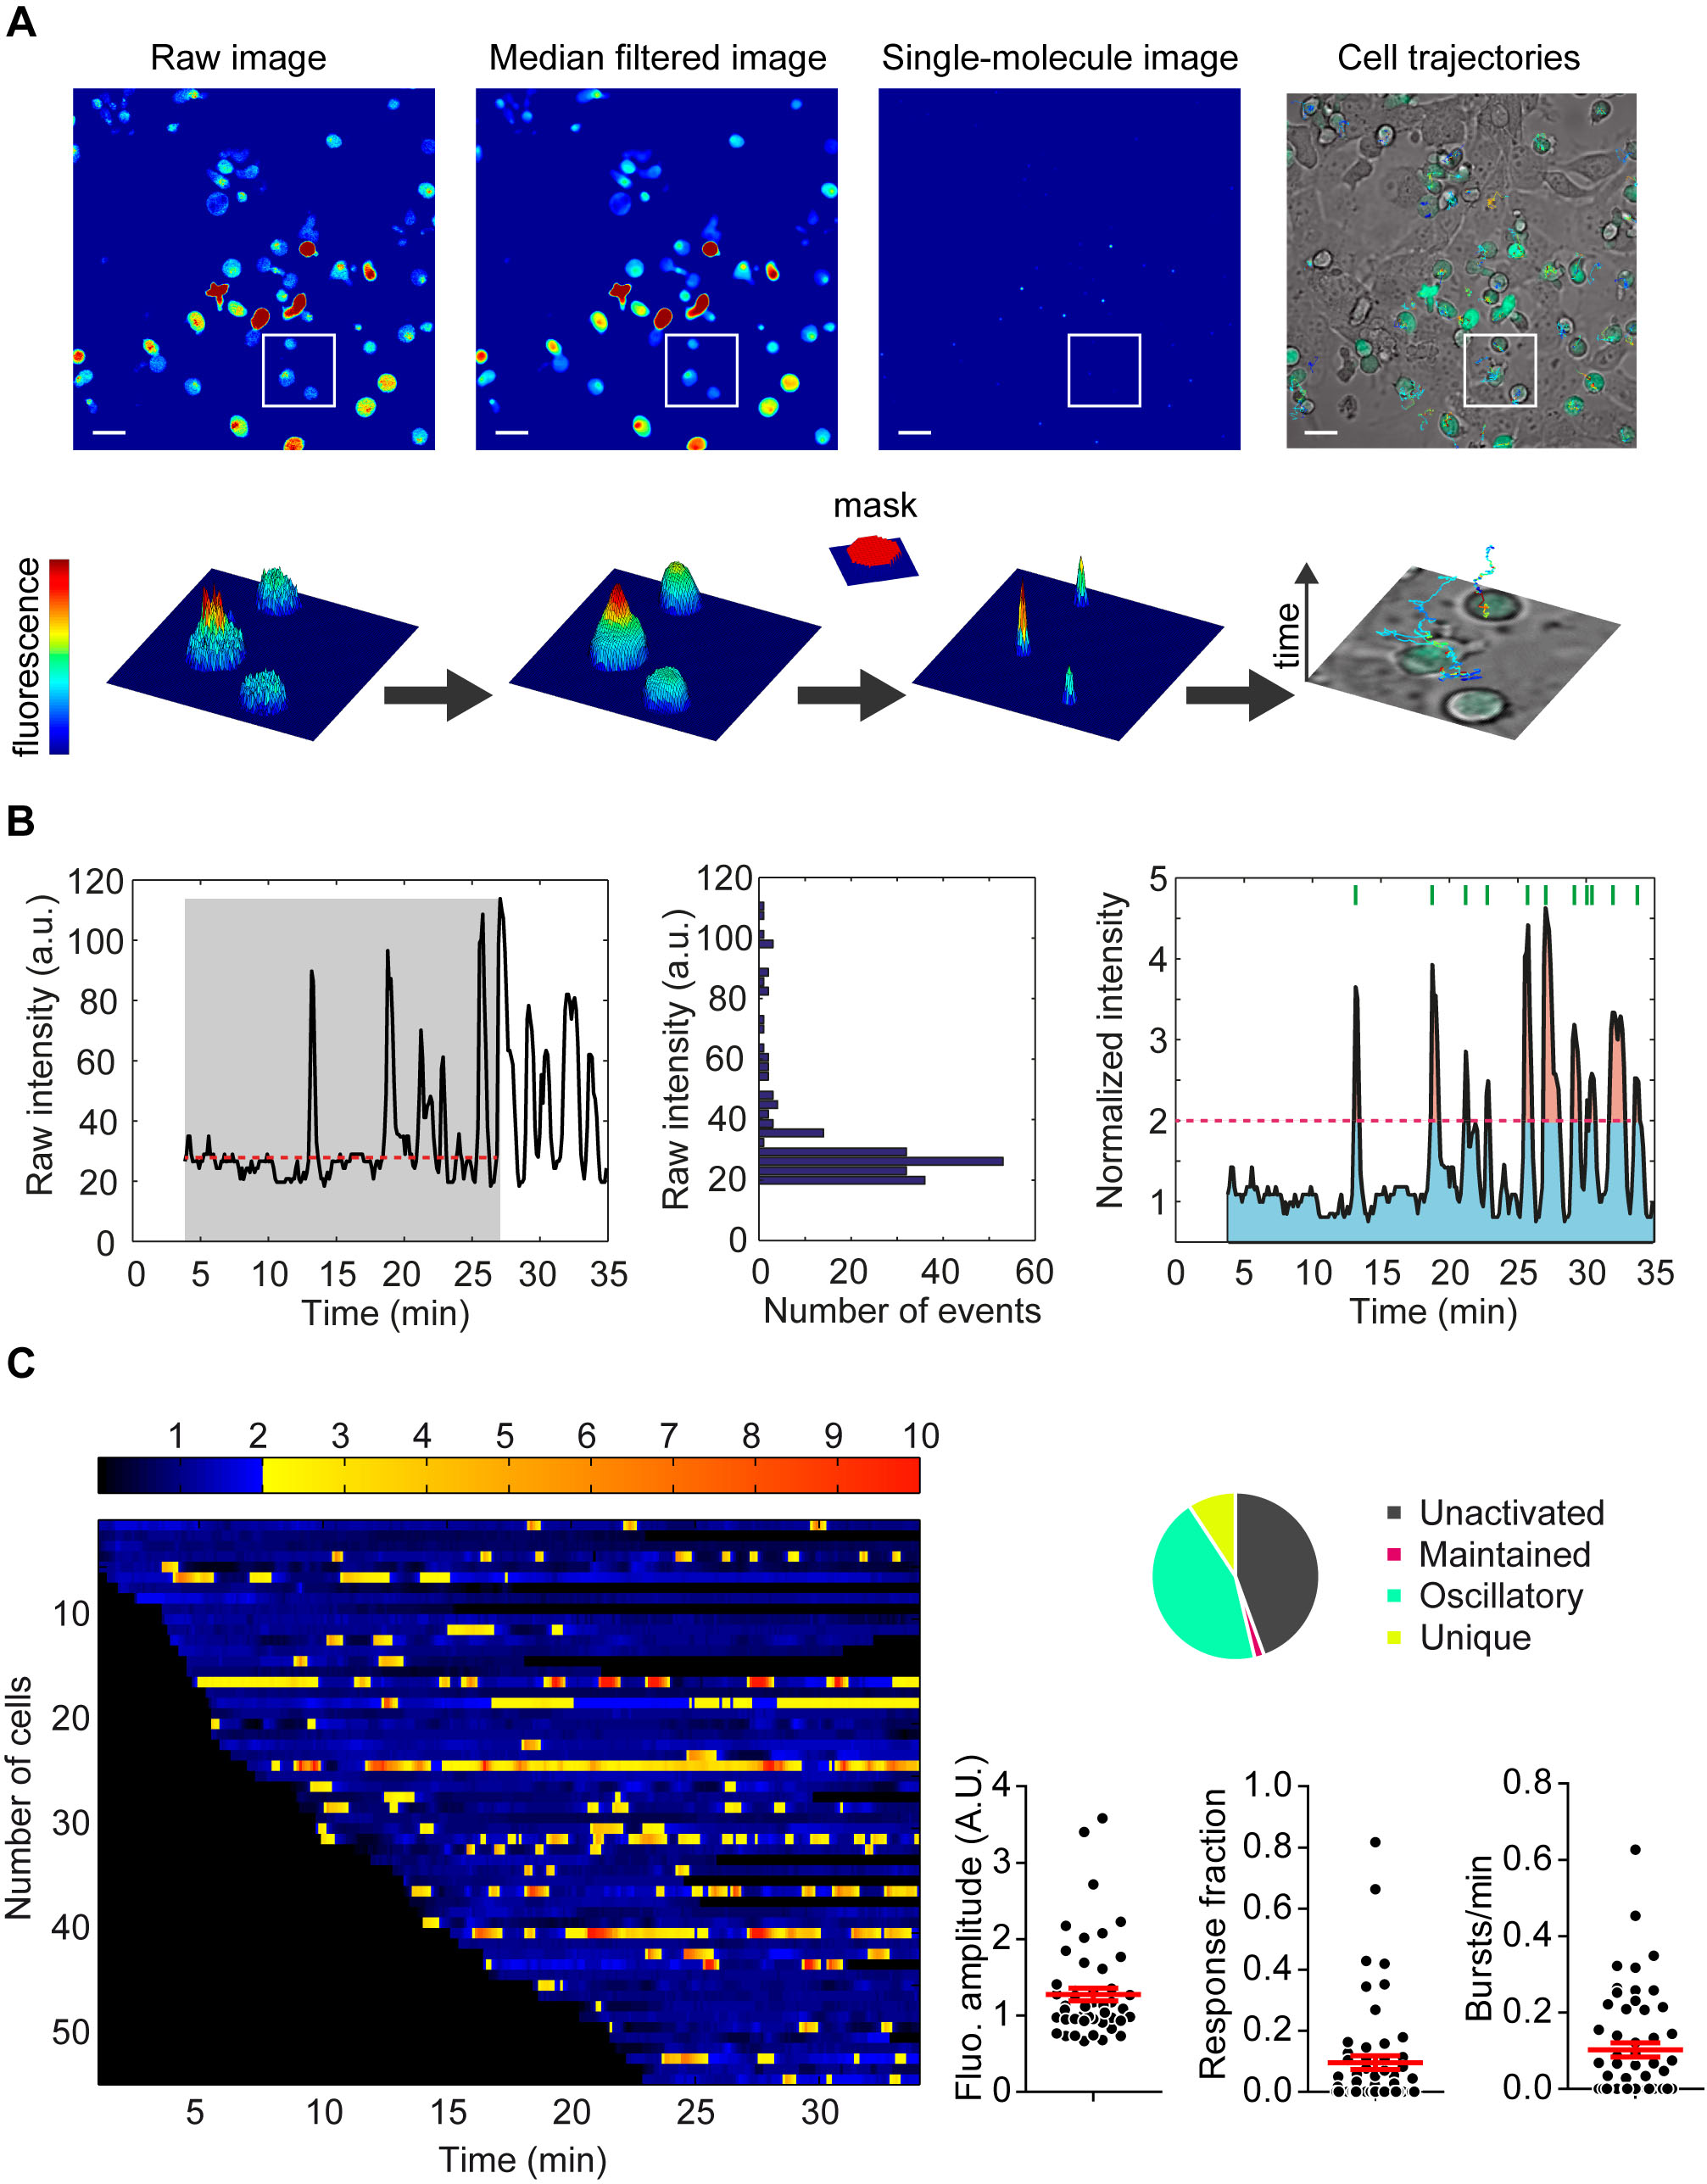
T cell calcium signal processing. (A) Automatic tracking of high density moving cells by MAAACS (B) Automatic signal analysis (normalization, thresholds). (C) Graphical representations of the quantitative parameters (% of responding cells, fluorescence amplitude, time fraction above threshold, frequency of bursts) calculated from a movie submitted to MAAACS analysis.
We have developed a series of experimental procedures enabling sensitive calcium monitoring in T cell populations by confocal video-microscopy (Salles A, Billaudeau C, et al. (2013) Barcoding T Cell Calcium Response Diversity with Methods for Automated and Accurate Analysis of Cell Signals (MAAACS). PLoS Comput Biol 9(9): e1003245. doi:10.1371/journal.pcbi.1003245). Tracking and post-acquisition analysis are performed by “Methods for Automated and Accurate Analysis of Cell Signals” (MAAACS), a fully customized program that associates a high throughput tracking algorithm (derived from our MTT algorithm), an intuitive reconnection routine and a dedicated statistical platform to provide, at a glance, the calcium barcode of a population of individual T-cells and a robust quantitative examination of the calcium response in cells.
Multiple Target Tracing (MTT) developed on Matlab by the H&M team, dedicated to single molecule analysis (SPT)
This homemade software was developed in close collaboration with Nicolas Bertaux (Institut Fresnel, PhyTi team) and was published in 2008 (Dynamic multiple-target tracing to probe spatiotemporal cartography of cell membranes, Serge, A. et al., Nat Methods, 2008, 687-94, 5). It is freely downloadable here.
The multiple-target tracing (MTT) tool takes advantage of the high resolution provided by single-molecule sensitivity. It generates dynamic maps at high densities of tracked particles, thereby providing a global representation of molecular dynamics in cell membranes.
MTT computation on experimental data. Left to right: raw data, individual particle localisation and map of EGFR confinement.
Dynamic multiple-target tracing to probe spatiotemporal cartography of cell membranes, Serge, A. et al., Nat Methods, 2008, 687-94, 5
Mapping molecular diffusion in the plasma membrane by Multiple-Target Tracing (MTT). Rouger V, Bertaux N, Trombik T, Mailfert S, Billaudeau C, Marguet D ,Sergé A J Vis. Exp. 2012 May 27;(63)
A shiny application to analyze tissue section imageS (SAPHIR)
SAPHIR have been developed by Elodie Germani in collaboration with Hugues Lelouard and Mathieu Fallet. This software allows to study cell populations in tissues using immunofluorescence.
Image acquisitions performed by confocal microscopy notably allow excellent lateral resolution and more than 10 parameter measurement when using spectral or multiplexed imaging. Analysis of such complex images can be very challenging and easily lead to bias and misinterpretation. We have developed the Shiny Analytical Plot of Histological Images Results (SAPHIR), an R shiny application for histo-cytometry using scatterplot representation of data extracted by segmentation. It offers many features, such as filtering of spurious data points, selection of cell subsets on scatterplot, visualization of scatterplot selections back into the image, statistics of selected data and data annotation. This application allows to quickly characterize labeled cells, from their phenotype to their number and location in the tissue, as well as their interaction with other cells.
The software have been published in F1000R : https://f1000research.com/articles/9-1276
SAPHIR is available here
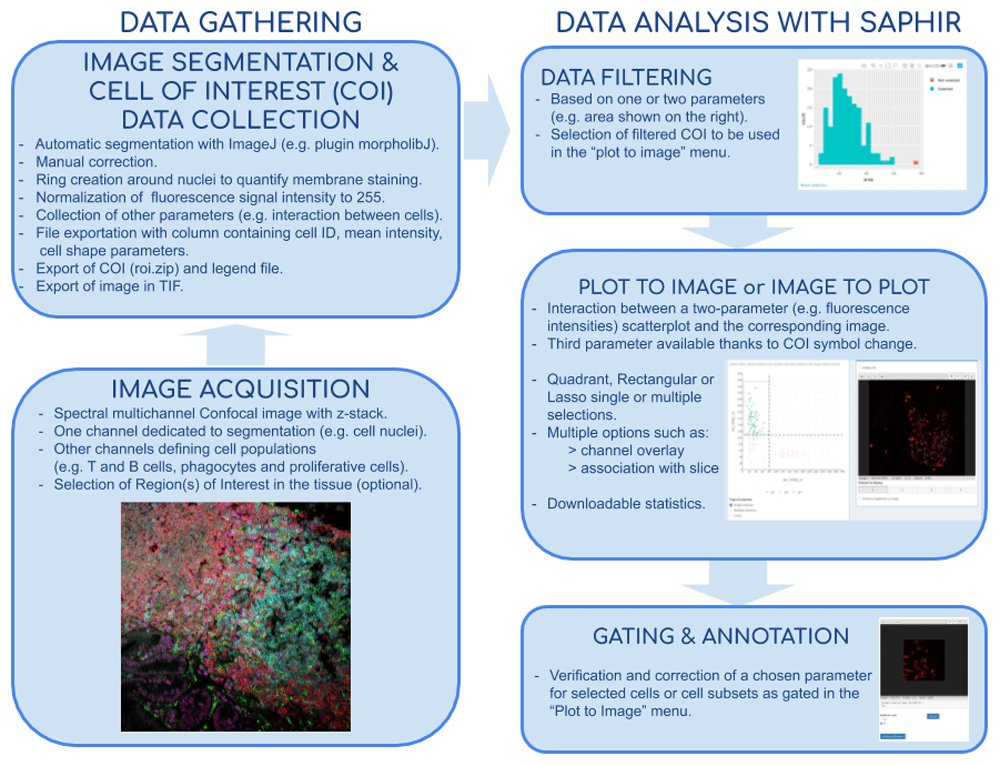
Flow chart of tissue image analysis from image acquisition and segmentation (left side) to extract data analysis with SAPHIR (right side)